- GETTING STARTEDLearn about Core EV topics

1. EV BASICS
Start your journey here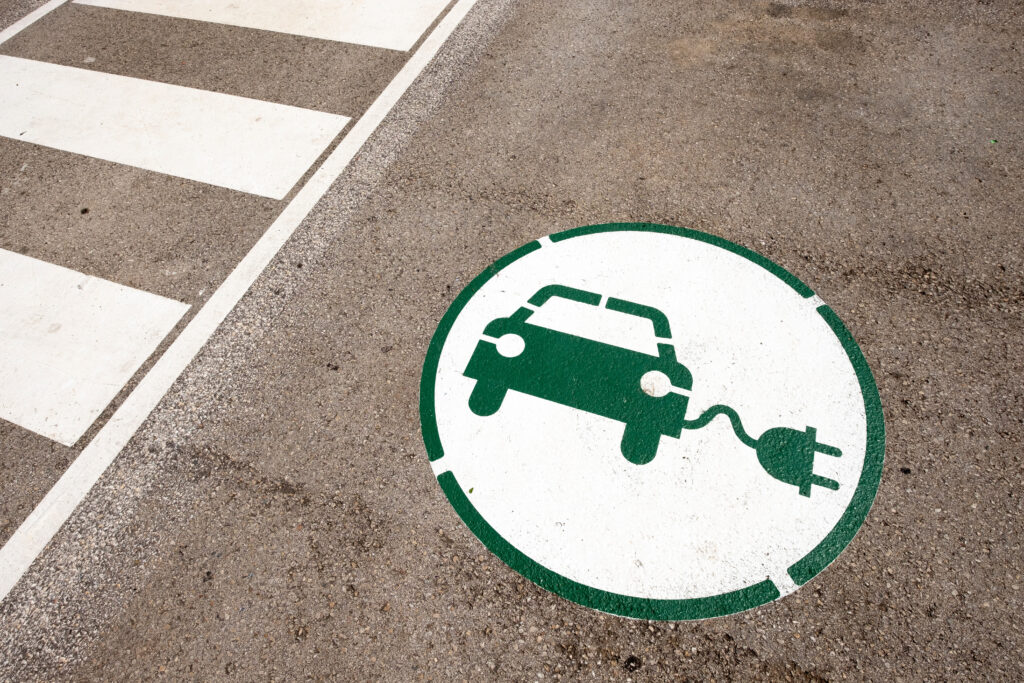
2. CHARGING + RANGE
What you need to go the distance
3. AFFORDABILITY
Everything you need to know about costs
4. PERFORMANCE
Understanding the driving experience
5. ENVIRONMENT
Understanding EV’s sustainability
6. SAFETY
Advanced safety features - EV RESOURCESTOOLS FOR PERSONALIZED INSIGHTS

ALL RESOURCES
Personalized tools
EV COST CALCULATOR
See the true cost of owning an EV
FIND A CHARGER
Search for EV chargers near you
PLAN A TRIP
Find EV chargers along your route
EMISSIONS CALCULATOR
Discover EV emissions savings
INCENTIVES FINDER
Find incentives you may qualify for - NEWS + INSIGHTSThe latest on all things ev